Architecture
Here we provide more details about the architecture and the testbeds.
Smart City Sensing and Wireless Testbed
Hardware
Three-tier architecture consisting of a Backend (servers), an Edge (small board computers) deployed on the street lamps/citizen houses/buildings and Endpoints (onboard sensors).
Backend Tier
Powerful servers
Edge Tier
The edge node consists of small board computers (SBC) and an AI node that provides an IoT access point that can house a variety of radios and sensors in stylish, interchangeable modules.
- Computing Power
All nodes are powered by a Raspberry Pi 3+.
Edge-capable nodes are powered further by a Jetson Nano.
- Radios
Nordic Semiconductor nRF52840 with Power Amplifier capable of both BLE and 802.15.4 using Contiki-NG.
Texas Instruments CC1310 868MHz long-range radio supported by Contiki-NG.
HopeRF RFM95W LoRa transceiver
RAKwireless RAK2247 LoRaWAN gateway (on selected nodes)
GPS receiver for time synchronisation
Wi-Fi radio for backbone connectivity
4G cellular dongle for backup connectivity
- Enclosures
Equipment is housed in three large and three small diamond-shaped plastic modules.
For new projects, different hardware can be plugged into the modules using USB 2.0.
- Deployment
UMBRELLA nodes can be mounted on posts or walls in different settings, whether roadside on lamp posts, factory walls or shopping venues.
Different edge nodes variants
Road Side Standard (RSS)
UMBRELLA Endpoint
UMBRELLA Ambient HAT
ICM20600 6 DoF IMU
SPH0645LM4H I2S Microphone
BME680 Temp Humidity Sensor
MICS-6814 Multi-Gas Sensor
SDS011
Road Side Edge (RSE)
RSS + Jetson Nano Developer Kit 4GB
Road Side LoRa (RSE-L)
RSE + LoRa Basestation
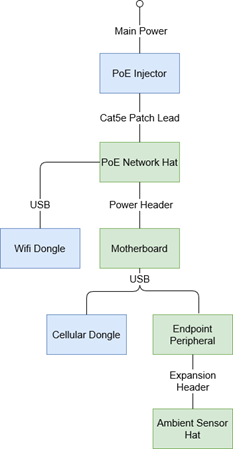
Edge Schematics
The Umbrella Node hardware can be considered composed of several interacting subsystems. Blue items indicate OTS hardware modules; Green items indicate Toshiba-BRIL designed modules.
The Umbrella node requires a mains power supply to operate. The power over ethernet injector receives a mains voltage supply regulated down to 5V DC and 48V DC supplies to the Network Hat.
The modules that make up the Umbrella system are powered mainly by a mixture of 5V DC and 3.3V DC. The power supply to the motherboard is composed of a PoE injector and the PoE Motherboard hat.
Hardware Block Diagram of Umbrella Road-Side Node
The network hat provides a network interface to the Raspberry Pi (Microchip LAN9512 10/100 Ethernet to USB bridge). A USB connection is also provided to an AR9271 Wi-Fi Dongle.
A power monitor has been incorporated into the design of the network hat. The device communicates power consumption through an I2C interface to the SAMD21, located on the motherboard.
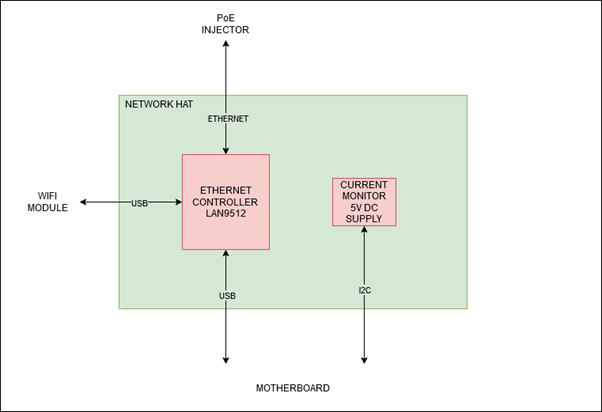
Hardware Block Diagram of Umbrella Motherboard PoE Network Hat
The motherboard is a Toshiba BRIL PCBA containing interfaces to a Raspberry Pi Compute Module 3 and other components for sensing and communication with peripheral devices and modules. The below diagram highlights the main communication mechanisms between modules.
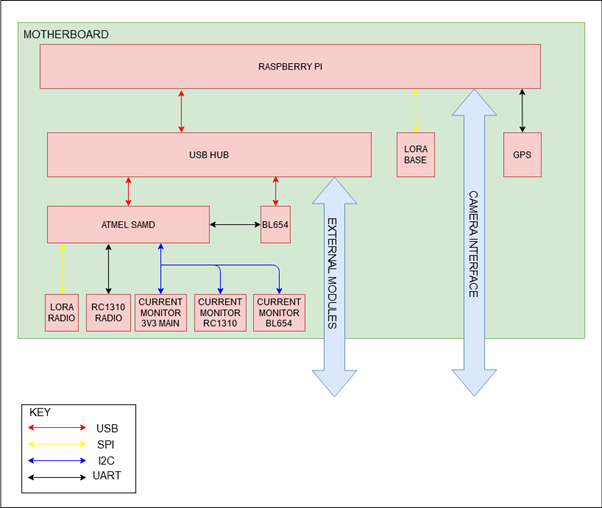
Hardware Block Diagram of main Umbrella Motherboard communication channels
Camera Interface: Two standard CSI connectors have been provided on the motherboard to connect cameras to the Raspberry Pi.
GNSS: A u-Blox NEO-M8 GNSS module provide location tracking capabilities for the Node device and provides concurrent reception of up to three GNSS. Communications with the GNSS occur through a UART interface on the Raspberry Pi.
Wireless Communication: The motherboard includes five radio modules.
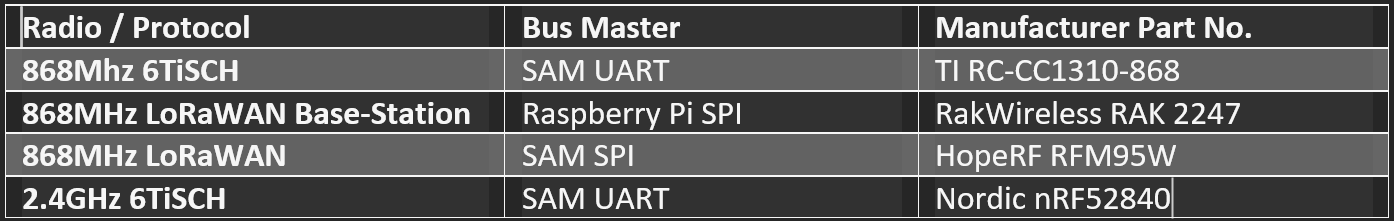
Radio modules on the Umbrella Motherboard, their bus masters and part numbers
Endpoint Tier
- Sensors
Air Quality (VOC Index, Temperature, Humidity, Air Quality Index)
Multi-gas (RED, OX, NH3)
Particulate (PM2.5, PM10)
NO2
OX (Oxidising gas for ozone and nitrogen dioxide)
Noise (for measuring ambient noise levels)
- Other
Sky-facing camera (for use in street light monitoring)
Endpoint Schematics
The Endpoint peripheral serves to provide a standard interface to external hardware. The Endpoint Peripheral exposes multiple hardware channels to the external device and provides 3.3V and 5V DC power.
Central to the endpoint operation is an Atmel SAMD21 which communicates with the motherboard via a USB interface and manages the hardware-specific operations necessary to interact with sensor modules.
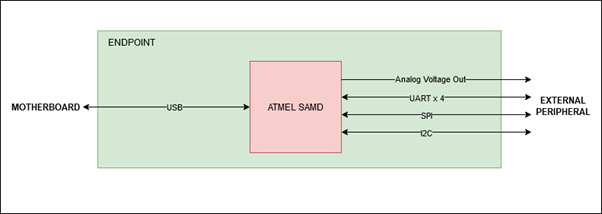
Hardware Block Diagram of the Umbrella Endpoint Peripheral Device showing the main communication channels between the motherboard and external peripheral
The ambient sensor hat provides the endpoint device with an interface to environmental sensors. Several sensor modules are situated on the hat itself, and additional sensor modules that could not be accommodated on the standard Hat PCB due to size limitations are provided with connections.
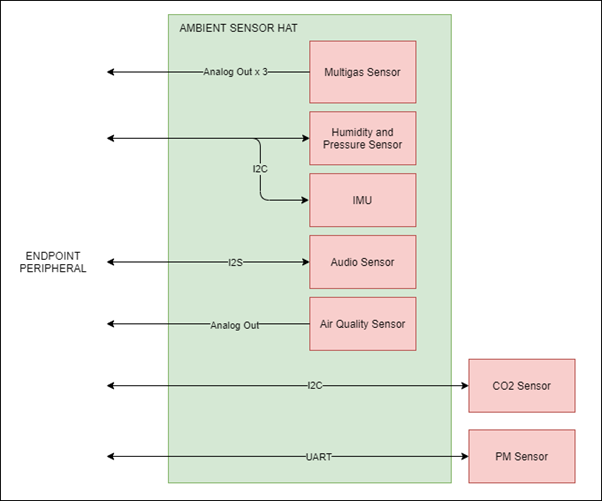
Hardware Block Diagram of Ambient Sensor Hat showing Main communication channels between local and external sensor modules to endpoint peripheral
Software
The Umbrella backend and testbed management portal support the various use cases by providing the standard facilities for users to log in and deploy software (services, firmware and applications) to evaluate experiments that run on the testbed.
Backend consists of
Container registry: The container registry package supports Docker-based container registries through the Harbor server, a key backend component for storing and managing the software relating to different users’ projects and experiments.
Software deployment on the testbed is achieved using the IoT Kubernetes deployment package based on a lightweight K3S version of the Kubernetes distributed processing framework.
The management portal is the main entry point for testbed users to access the testbed and run experiments.
The asset management package permits the monitoring and management of the Umbrella system, including all the nodes, software and network interfaces.
The analytics package performs functions related to processing and displaying Umbrella system KPIs, API usage/performance and errors, and alerting anomalies.
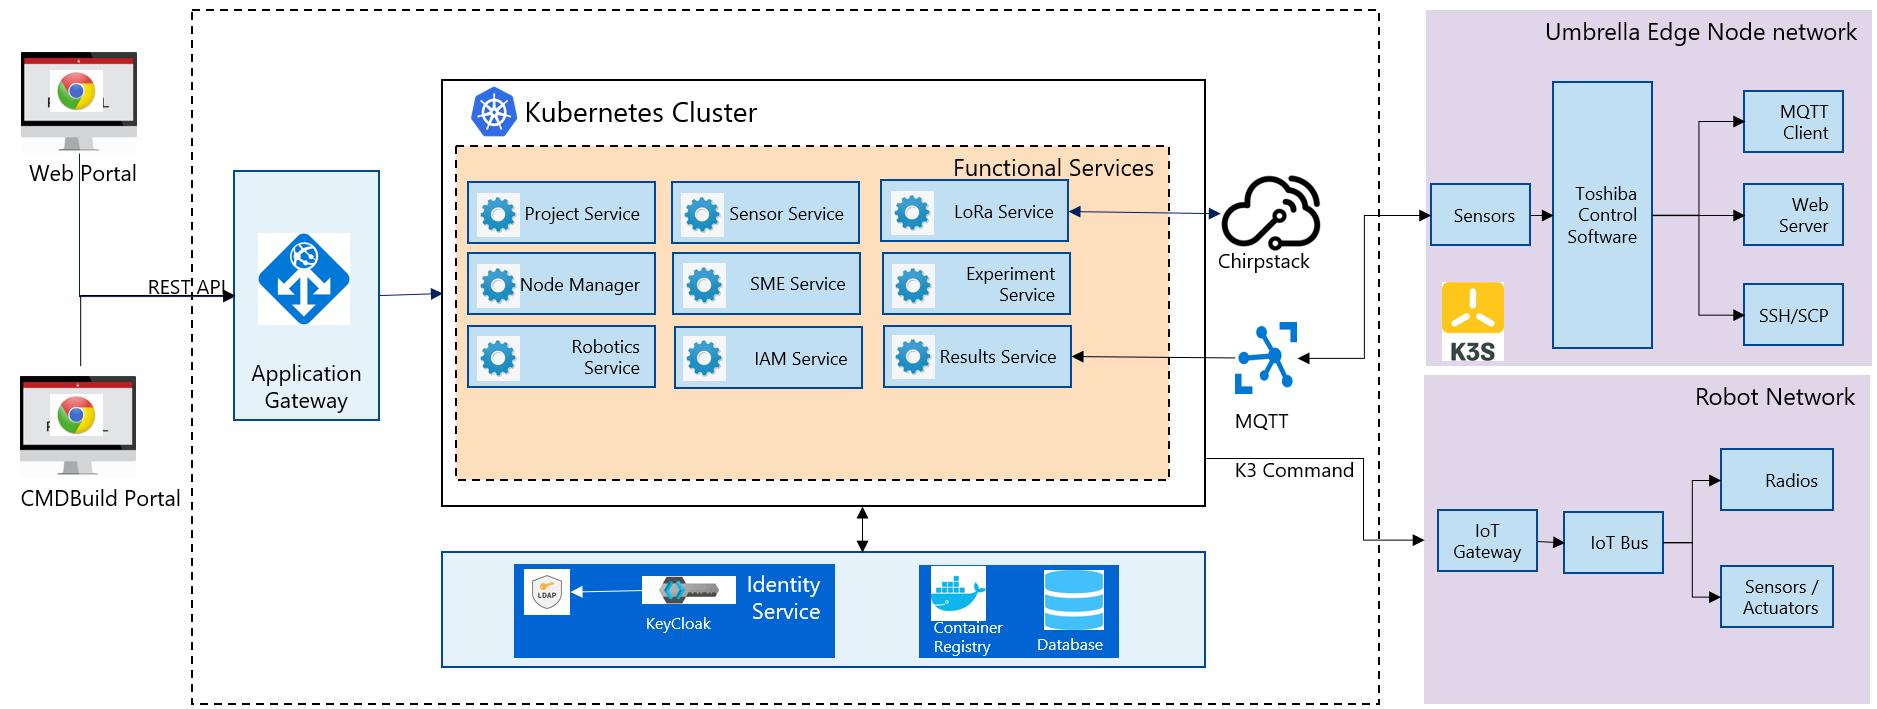
UMBRELLA Smart Sensing and Wireless Testbed Architecture
Microservices
The umbrella platform is based on micro-service architecture, and user access is controlled as per the assigned role based on the Role-based access control (RBAC) mechanism.
All the applications are deployed in a containerised fashion using Docker Containers, and the orchestration of the different containers is provided by the Kubernetes (K8s) framework.
Each micro-service has one micro gateway, which provides security and API routing functionality.
Different Microservices:
Project Service: Responsible for creating and maintaining the projects for Umbrella Network and Robot Network
A user can create a project from the umbrella portal, the project service internally makes a project in the Harbor registry, and all the Umbrella Network/Robot Network projects are linked with Harbor projects.
Uploaded images are stored in the Harbor registry under the respective project. As part of uploading an image, the service performs the image tagging and push to the Harbor registry, and image scanning is initiated immediately after the image is uploaded successfully. Also, image types, i.e. “Raspberry Pi” and “Jetson Nano”, are maintained in the project service database.
Binaries are stored in Minio Object storage. The service keeps the binary inside the folder (bucket) name the same as the project id. Binary types, i.e. “nrf52” and “cc1310”, are maintained in the database for each binary.
This service provides multi-user support for a project by adding a user to the existing Harbor project, and Harbor maintains the project users and their roles. This service also takes care of maintaining the Umbrella Network user approval status.
Project service communicates internally with other microservices such as experiment, node manager, IAM, and Lora.
Experiment Manager Service: Responsible for creating/running experiments
It handles the creation, starts and stops of the experiment. There are two ways to create experiments (i) scheduled experiment and (ii) run as soon as available node experiment.
The user provides the experiment start and end time for scheduled experiments. The service checks the node availability for the user-provided time and schedules accordingly. It also includes detailed information about nodes’ availability for a given period for the user to plan the experiment.
Run as soon as available node option; the user cannot provide the start time, and the service decides the appropriate start time based on the user’s selected nodes.
Experiment logs are provided after the end of the experiment for user analysis. These logs are fetched using Elastic Service and stored in Minio Object Storage. Currently, logs are formatted and stored per node basis.
Result Manager Service: Store and visualization of experiment result
The service subscribes to MQTT topics to retrieve experiment results data with the MQTT broker.
Edge nodes publish the experiment results data to the MQTT broker.
On receive of data on specific MQTT topic i.e. experiment/{experimentId}/{hostname}/{streamId} , data will be stored in influxdb against the experimentId.
Node Monitor Service: maintains the details and status of Umbrella Network nodes and Robot Arena robots.
Nodes and robots send a heartbeat every 10 minutes, and the node/robot analytics data every 2 sec.
Asset Management Service
The service runs a scheduled job every 30 minutes that collects the node information such as hostname, node type, familiar name, GPS hash, and status to update the asset inventory.
IAM Service: Assign/Amend user roles.
IAM service exposes API that will help to add new roles to the user.
Portal service
The service is the primary consumer of all the APIs exposed by other services. It provides a user interface to use the Umbrella testbed and adapt it according to the user roles.
Robotics Testbed
Industrial IoT approach based on the IEC 30141 IoT reference architecture and using Industrial IoT connectivity standards (REST/DDS)
Hybrid cloud approach permitting remote access and experimentation
The digital twins are simulators and machine learning models representing physical nodes or devices. For instance, robot simulators based on the open-source Gazebo or other software platforms.
The main functions are configuring the simulator or model environment, loading appropriate node software, and running the simulations. Results can then be returned and displayed to the user.
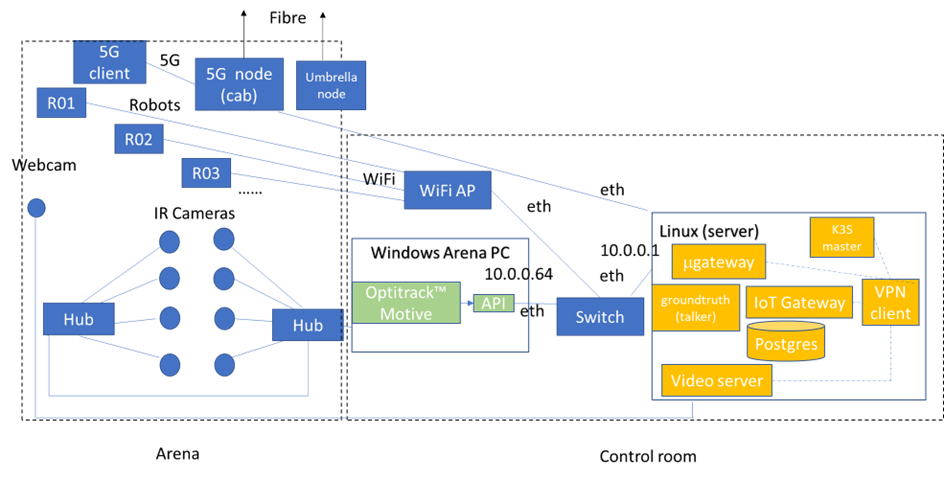
The Optitrack optical tracking system shall provide ground truth telemetry data for the robot node testbed arenas. The Optitrack system will use Infrared cameras deployed above the test arenas.
Hardware
Each robot is 25cm in diameter and can lift up to 4kg individually but can collaborate to tackle larger and heavier payloads.
Communication and Management Stack
Bluetooth 5.0/Wi-Fi (802.11ac)/Ultra-wide Band/(5G in the future)
Data Distribution Service (DDS)
Support for custom protocol stacks
Actuation
3 x Omnidirectional wheels
Lifter
Strain gauges
GPU
RockPi 4B based with four onboard cameras
Sensors
16 IR Laser time-of-flight distance
9-Degrees of Freedom (9DoF) inertial measurement unit (IMU)
Ambient temperature, pressure, humidity
Robot health (various voltage, current and temperature sensors)
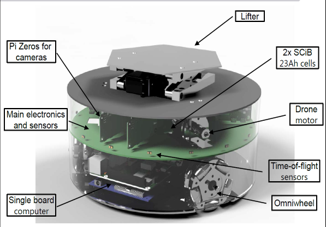
UMBRELLA ROBOT
Robot Specifications
The DOTS (Distributed Organisation and Transport Systems) swarm robots support movement, sensing, communication and actuation (lifting objects) and processing. The specifications are outlined below.
Specification |
Value |
|---|---|
Diameter |
250mm |
Height |
120mm lifter down and 200mm lifter up |
Speed |
2metres per second |
Acceleration |
2metres per second squared |
Max load |
2kg |
Battery capacity |
100Wh |
Battery life |
6 hours to 12 hours |
Battery charge time |
3 hours |
Drive |
Holonomic 3 servomotor driven omniwheels |
Processors |
RockPi4B 4GB and 4x Raspberry Pi Zero |
The robot exposes many sensors to the experiment containers through the corresponding ROS2 topics.
Sensor |
Type |
Update rate |
Max bandwidth (bytes/s) |
|---|---|---|---|
Cameras x5 |
OV5647 5MP |
Variable up to 60Hz |
Variable (eg 28M) |
Microphones x2 |
IM69D130 |
44.1kHz |
180K |
Laser time-of-flight distance x16 |
VL53L1X |
50Hz |
10K |
6DoF IMU |
LSM6DSM |
1kHz |
12K |
Magnetometer |
LIS2MDL |
1kHz |
6K |
Barometer |
LPS22HD |
1Hz |
<10 |
Temp/humidity |
Si7021-A20 |
1Hz |
<10 |
Strain gauge ADC x3 |
MAX11210 |
1kHz |
9K |
General purpose 8 channel ADC |
MAX11615 |
1kHz |
16K |
Power monitor x3 |
INA219 |
100Hz |
1.8K |
PSU status |
STM32L031 |
100Hz |
1K |
Battery status |
STM32L031 |
10Hz |
100 |
Radios are also provided in the robots, and users can flash the Bluetooth radios with custom firmware to evaluate user-defined protocols within experiments. The Bluetooth radios are accessed via the serial ports /dev/ttyACM0 and /dev/ttyACM1. In the simulator environment, the radios are emulated, and it is possible to provide a custom radio simulator for evaluating the proprietary protocols.
Technology |
Radio |
|---|---|
Bluetooth |
two nRF52840-based radios (/dev/ttyACM0 and /dev/ttyACM1) |
WiFi |
802.11ac compliant onboard radio |
Software
The collaborative robot testbed software architecture is illustrated below.
Robot testbed software architecture
Robot Arena
The maximum number of robot nodes that can be used in experiments in the robot arena is 10 to 20, depending on the status. The status of a robot is either available or unavailable, and only the available robots are indicated in the experiment configuration step. A robot’s status is unavailable when recharging or undergoing maintenance or repairs.
The ground truth system captures the actual robot positions available in the ROS2 topics
/rt/<robotid>/odomand is stored in ROS2 bag log files.
Digital Simulator Environment:
The architecture administrators can limit the number of robot instances permitted in the virtual experiments, allowing the user to run experiments using, for example, up to 120 robot instances, with swarm behaviour.
The portal provides access to the simulator deployment environment in the cloud and the arena.
The ground truth data from the Gazebo simulator, which contains the robot positions, is available in the ROS2 topics
/rt/<robotid>/odomand is stored in the ROS2 bag log files.In the simulator, the user can use an additional radio simulation experiment container and additional configuration files in each experiment.
The digital twin setup and deployment of the Robotics Testbed allows a user to run simulation experiment containers in the cloud-based simulator environment; in the same way, the user runs experiments in the physical arena. How the experiment software is deployed and interacts with the gazebo simulator and physically with the robot nodes is the same: the simulator and physical arena use the ROSv2-based Data Distribution Service (DDS).
The main difference between the physical node’s environment (left side) and the simulation platform (right side) is the ability to configure the simulation environment using environment world files. Deploying on the simulation environment permits the validation of experiment containers on the simulated environment (right side) by appropriate loading environment (world) files and then deploying to the actual arena robots (left side).
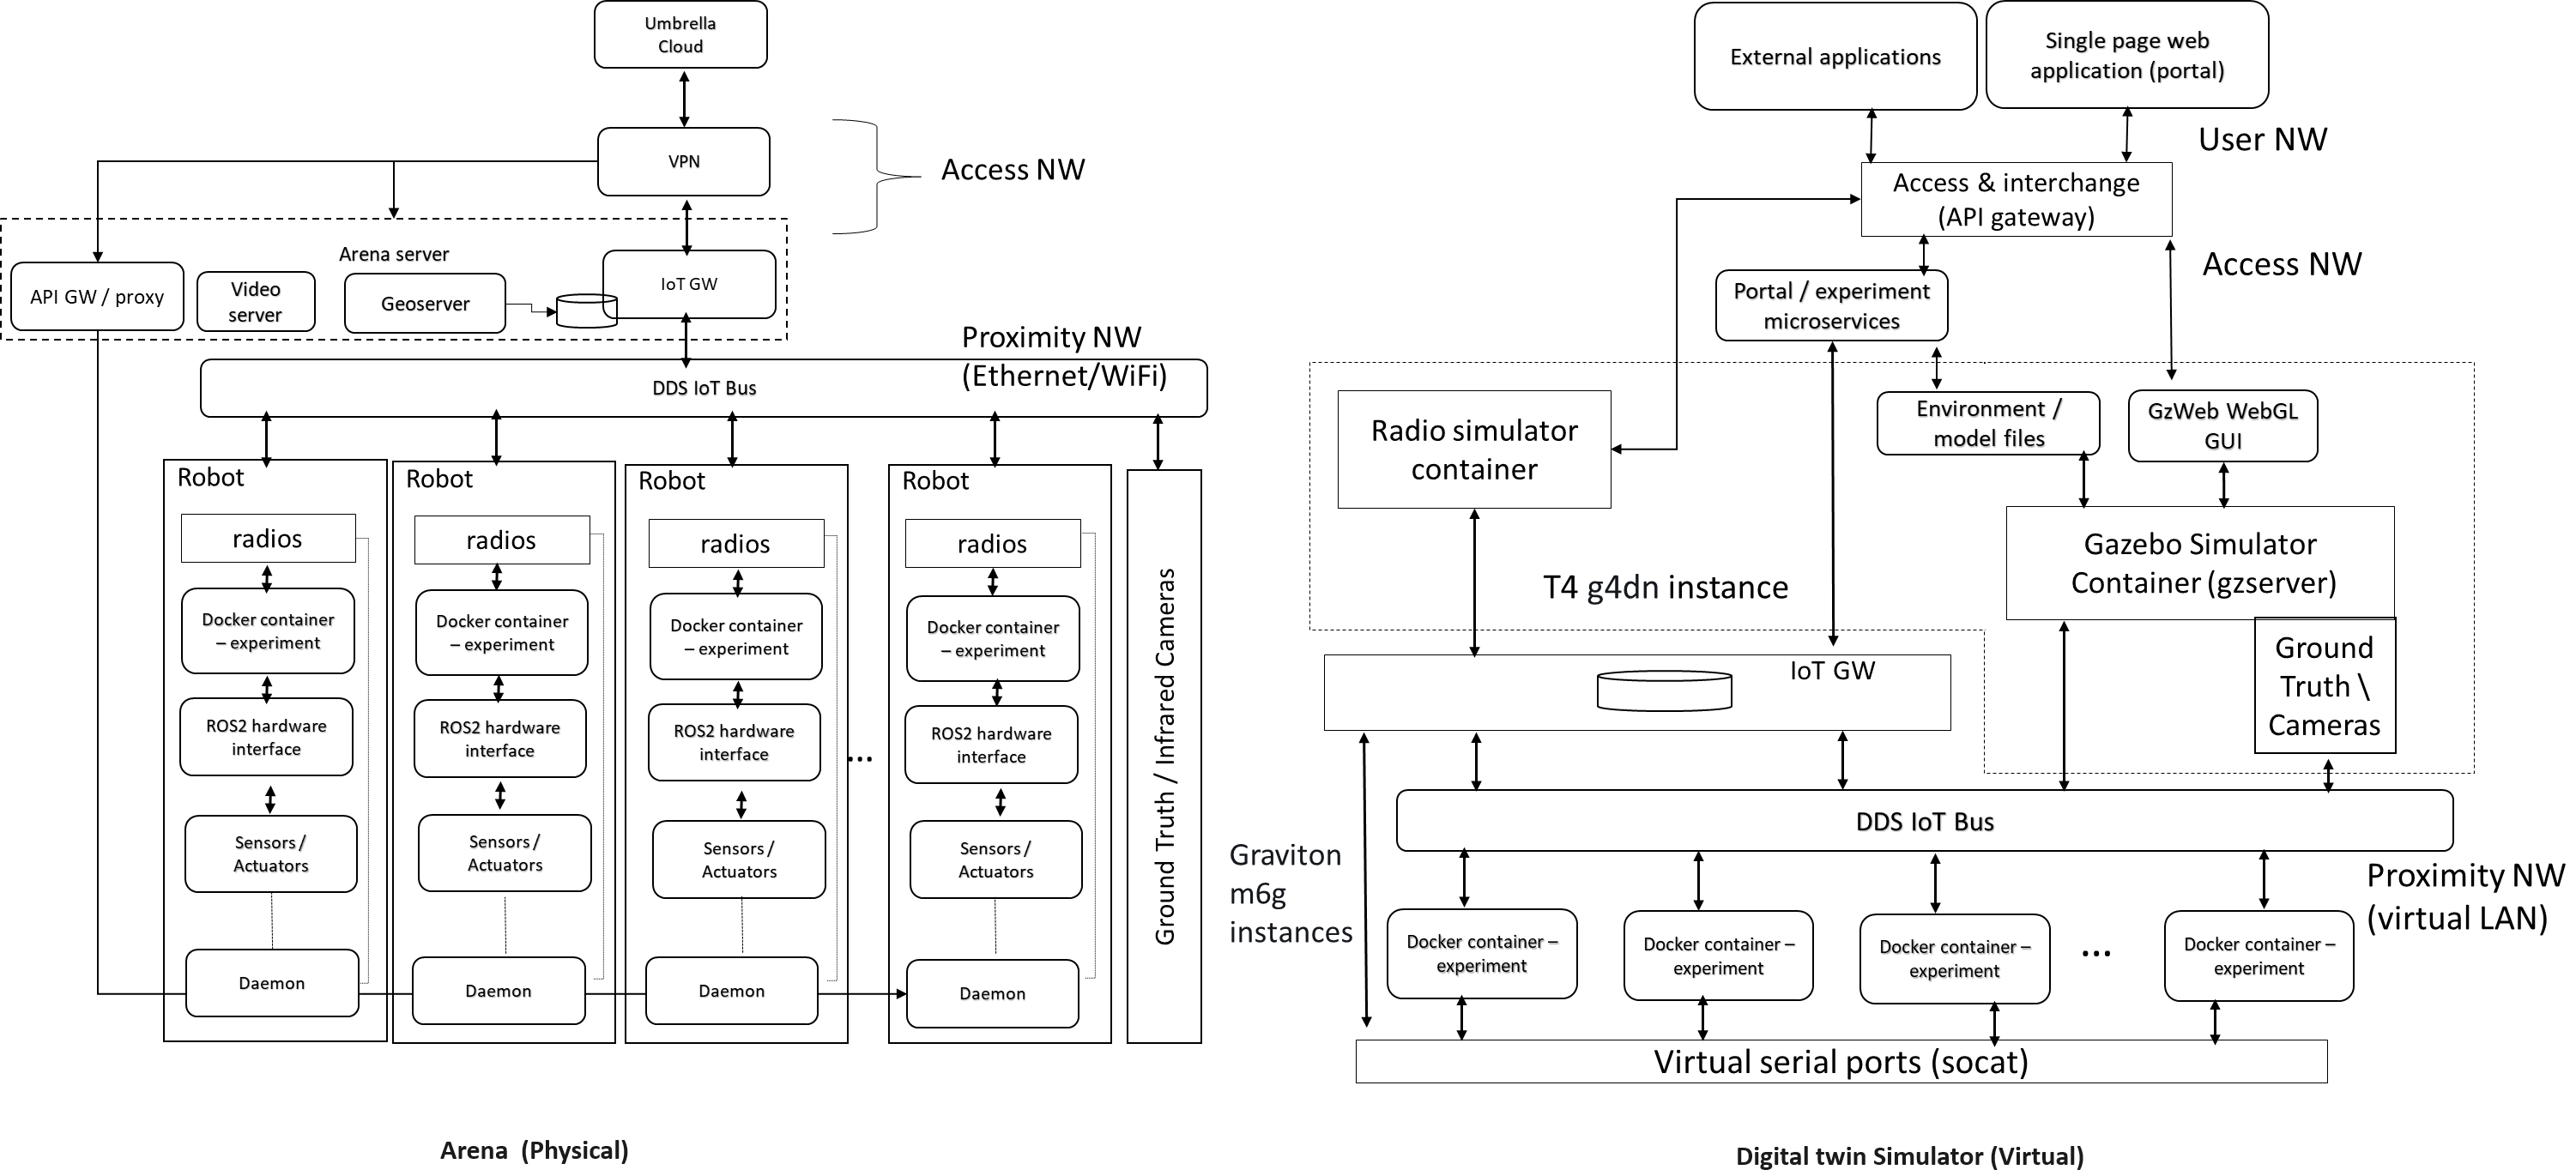
Robot testbed software architecture
The deployment is achieved by emulating two interfaces exposed to the containers.
First is the virtual serial ports interface, which is mapped to the real radio interface and redirects the interactions via the radio simulator.
Second, the interactions with the ROS2 hardware interface (left-side diagram) are mapped via the DDS IoT bus (right-side diagram) to the gazebo simulator for the simulated environment models.
Software stack layer
The software stack is presented below and relies on integration with DDS and ROS2 to support different APIs (C++, Python and REST API for external application access).
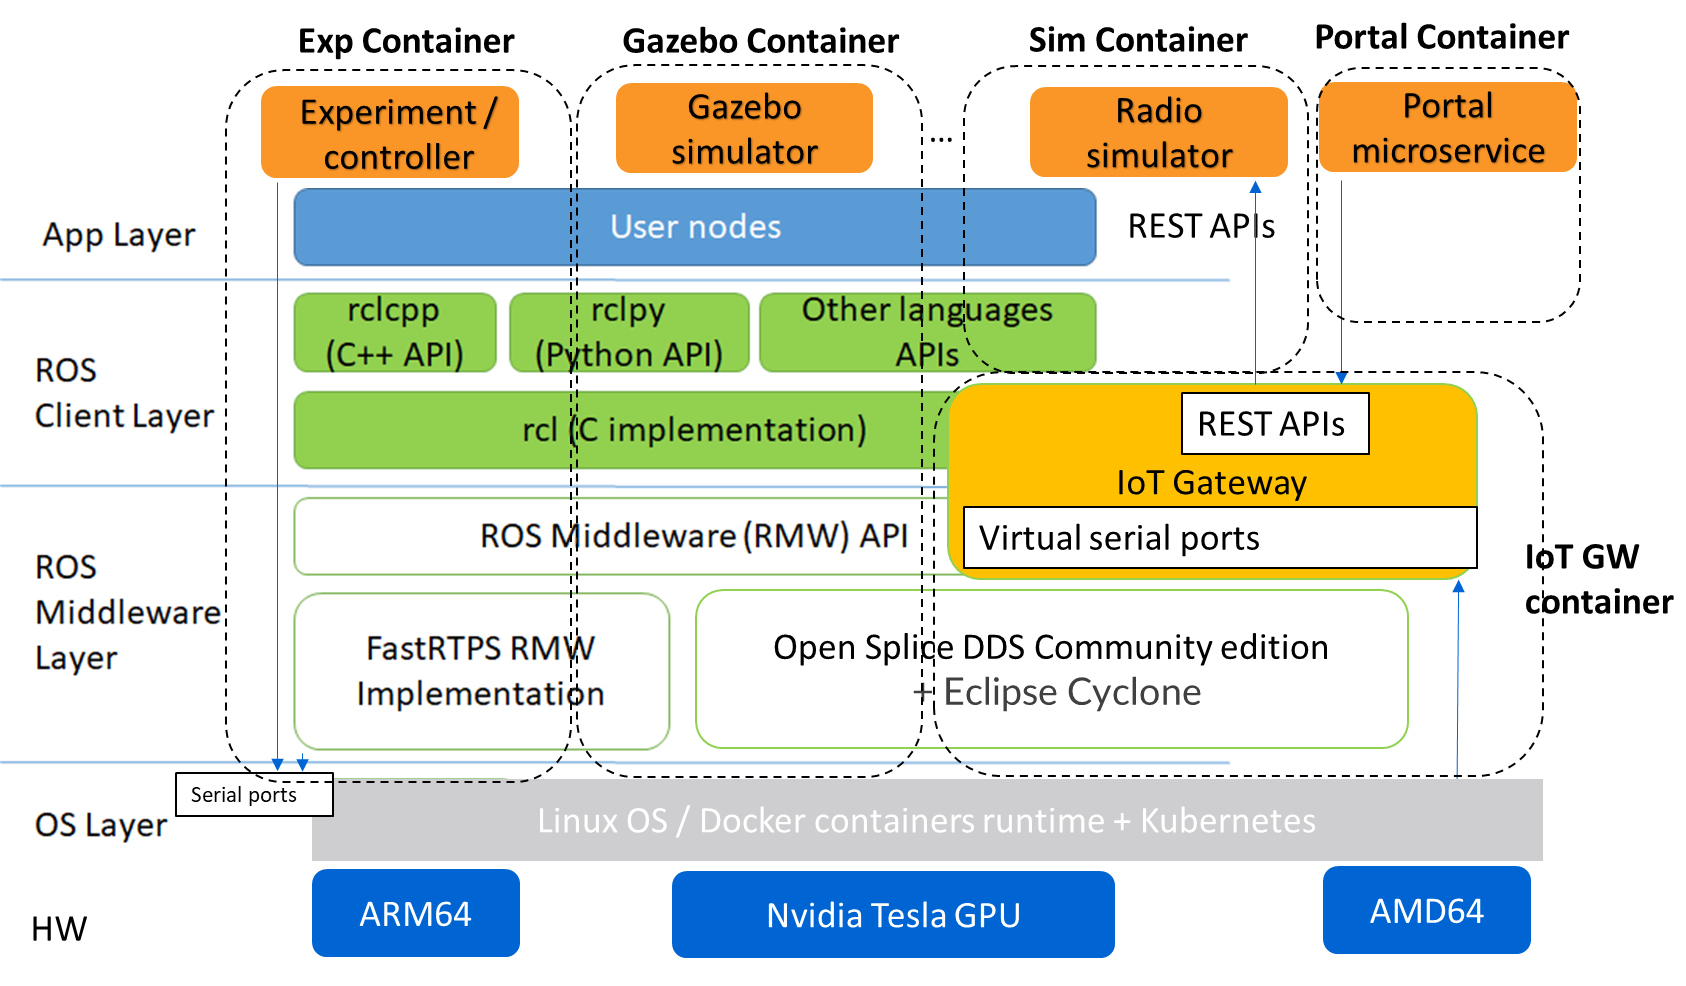
Software stack layers
Interfaces
REST based
Several interfaces are required to facilitate the interaction. The interfaces permit deployment of the experiments, retrieval of data subsequently to the experiment running and the visualisation of, for instance, the simulation or the video camera overlay.
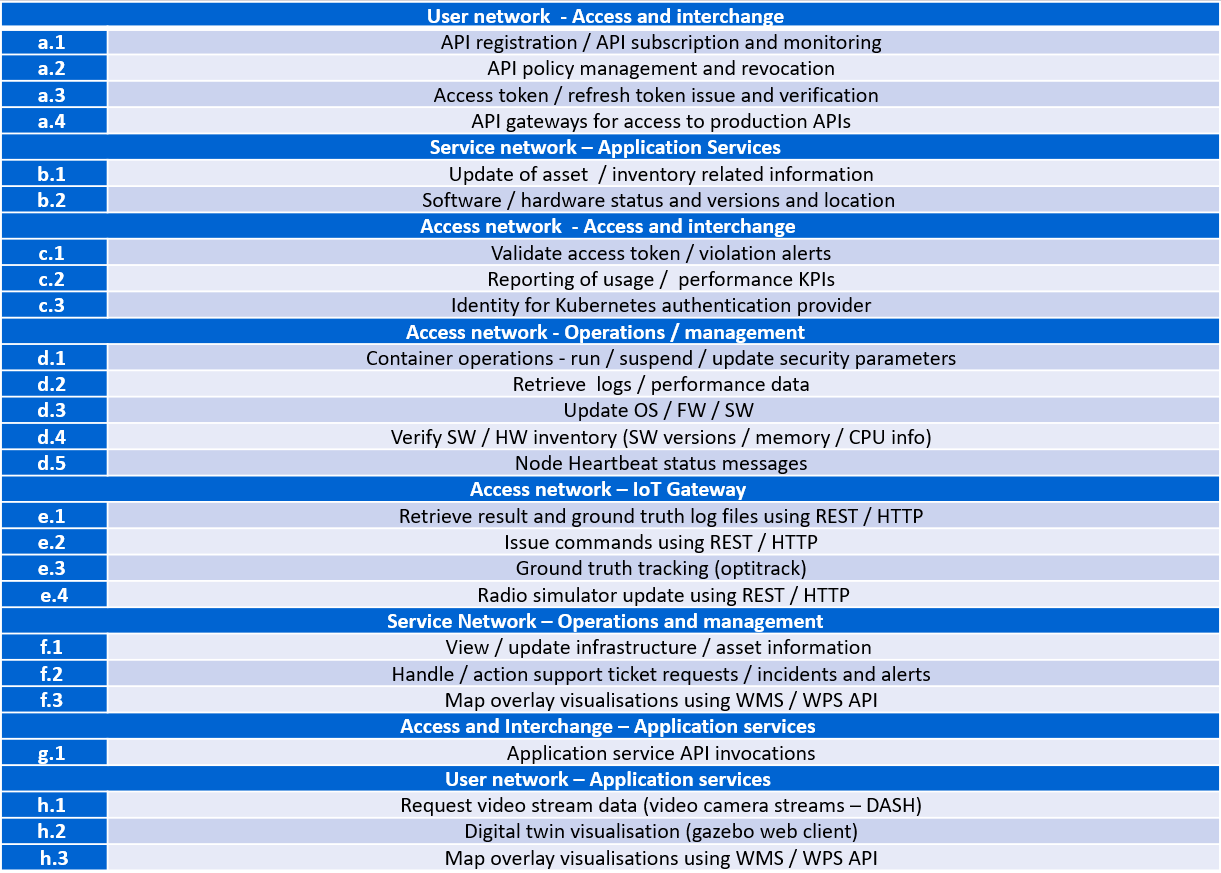
REST Based interfaces
IoT Bus Topics
DDS topics have been defined (primarily based on the ROS2 topics) to support the robots and experiment interactions.
ROS topic partitions use the prefix
rt/<robot_id>/.robot_iddistinguish between the different robots.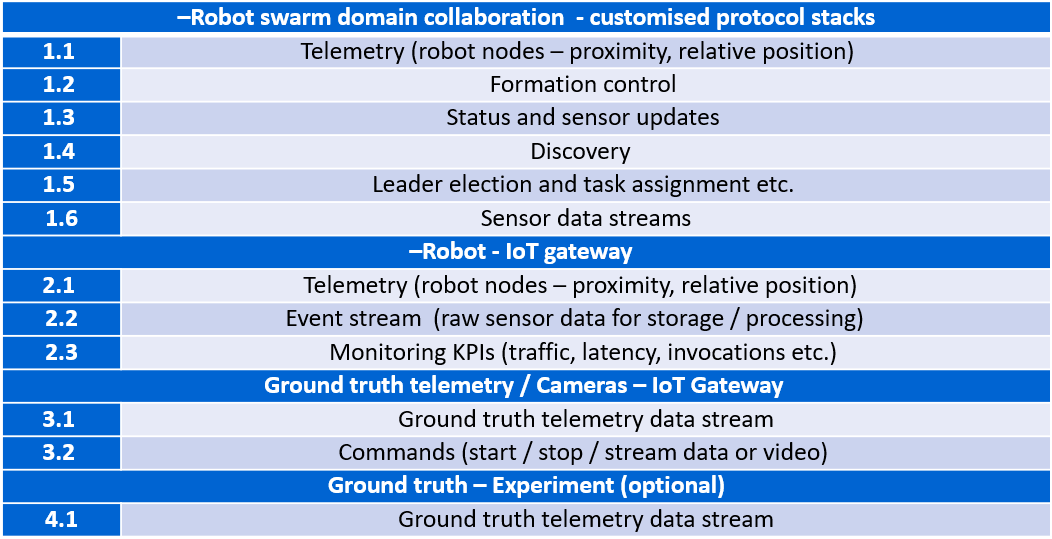
REST Based interfaces
The table below lists the ROS2 (DDS) topics. All topics are prefixed with the robot hostname (with dashes converted to underscores), e.g. /robot_88e9a579/cmd_vel.
Topic |
Type |
Dir |
Notes |
|---|---|---|---|
power_en |
std_msgs.Bool |
In |
Enable actuator power (motor and lifter). This is a watchdog reset that starts a 50ms hardware countdown and power will be cut without repeated true messages received. This must be sent by the control server only when the big red button is enabled. |
motor_en |
std_msgs.Bool |
In |
Enable motor control. \ Power must also be enabled for the motors to run. |
cmd_vel |
geometry_msgs.Twist |
In |
Set velocity and angular velocity of motor drive. |
lifter |
td_msgs.Bool |
In |
The value True causes the lifter to move to a raised position. \ The value false causes the lifter to be moved to a lowered position. \ A message received while lifter is in motion will change motion if new goal is different |
led |
std_msgs.Int32MultiArray |
In |
RGB control of the 16 perimeter LEDs. \ 16 entry array with (B[23:16]; G[15:8]; R[7:0]) |
sensor/mode |
std_msgs.Int32 |
In |
0 - Normal operation; 1 - Run IMU calibration |
reflect_in |
std_msgs.Float64 |
In |
Ping message in |
reflect_out |
std_msgs.Float64 |
Out |
Ping message out |
cam0/image/compressed |
sensor_msgs.CompressedImage |
Out |
Front left camera. All cameras are 640x480 30fps MJPEG |
cam1/image/compressed |
sensor_msgs.CompressedImage |
Out |
Back left camera |
cam2/image/compressed |
sensor_msgs.CompressedImage |
Out |
Back right camera |
cam3/image/compressed |
sensor_msgs.CompressedImage |
Out |
Front right camera |
cam4/image/compressed |
sensor_msgs.CompressedImage |
Out |
Lifter camera |
sensor/scan |
sensor_msgs.PointCloud2 |
Out |
Distance readings from the 16 IRToF sensors around the perimeter. \ Set subscription qos to qos_profile_sensor_data |
sensor/imu |
sensor_msgs.Imu |
Out |
IMU readings |
odom |
nav_msgs.Odometry |
Out |
Integrated and transformed wheel positions. |
sensor/battery_state |
sensor_msgs.BatteryState |
Out |
Current battery status |
sensor/temp |
sensor_msgs.Temperature |
Out |
Temperature |
sensor/pressure |
sensor_msgs.FluidPressure |
Out |
Atmospheric pressure |
sensor/humidity |
sensor_msgs.RelativeHumidity |
Out |
Relative humidity |
Microservices
- Robot Experiment Manager Service
The service primarily handles the Robot Network feature and creates and launches digital twin and Robot Arena experiments. Digital twin and Robot Arena experiments run as per the creation time.
Digital twin and Robot Arena have separate queues from which experiments are picked and deployed. With the current flow, Users can create robot arena experiments only after successfully validating of controller image with a digital twin experiment.
Gazebo Simulator is used as a digital twin in Robot Network. A separate Kubernetes Cluster is available to run the Robot simulator experiment on two nodes (x86 and ARM architecture VM). The service handles the deployment of Radio Simulator, Gazebo Persistent Volume, World Listener and Gazebo service on the x86 node and IoT Gateway, micro Gateway and controller services on the ARM node. Virtual serial ports send controller data to the Radio simulator, and around 40 virtual serial ports are created statically.
Robot Arena is in a separate Kubernetes cluster where 20 (approx.) physical robots are supported. The technician who will be present near the robots will be responsible for starting, stopping or cancelling the experiment. As an experiment result, a heatmap, a live video feed of the arena and the option to record & download the feed are supported.
Containerized components
Radio Simulator
The radio simulators provide a REST API for redirected radio serial port messages. The API context/msg is used for sending the redirected serial port messages into the simulator instance (by default on port 80). The response contains the performance estimates for the different destination robots. The experiment container pseudo TTY serial ports are mapped using volume mounts within the container initialisation to permit the multiple experiment containers to coexist on the same VMs using the same serial ports from the experiment perspective. A serial port corresponds to each radio in each robot/experiment container. Hence there are 3 per robot instance; one for UWB and two for Bluetooth. In the future, the testbed could also support a 5G radio. The Wi-Fi device within the RockPi4 main board is not customarily exposed using USB interfaces. However, it is possible to create additional virtual serial ports and use IP to serial encapsulation (i.e. SLIP) to pass messages over the serial port. In this case, four serial ports per robot instance are required.
In addition, the REST API for ground truth takes the location position and orientation of the robots obtained from the gazebo simulator. The ground truth position is specified in metres for x,y and z coordinates. The quaternion rotations in radians define the orientation for x,y,z and w. The timestamp is specified in seconds and nanoseconds since the start or system start time.
IoT Gateway
The IoT Gateway exposes the device API, which has the following functions.
/device/validate       - validate the simulation after the experiment is run
/device/redirectport   - redirects a serial port to the radio simulator
/device/bridgeport     - bridges a serial port with SLIP based interface
/device/closeports     - close serial ports
/device/uploadfirmware - upload a firmware binary for flashing on the robots
/device/flash          - flash firmware on a robot (arena)
/device/map            - retrieve ground truth map
/device/ports          - retrieve port mapping
/device/groundtruth    - retrieve (get) the latest ground truth and delete data
/device/data           - retrieve device (gateway) data
Also the /geoserver API is exposed as a proxy for obtaining heatmap images from the geoserver.
Gazebo Simulator
The Gazebo simulator models the robots and their environment. The arena environment is defined using world files, which can be representative of the actual Arenas or more complex deployments.
Validation mode: uses a predefined arena world (operates in validation mode)
User-defined worlds: for evaluation of larger or more complex scenarios
Radio simulators: evaluate custom protocol stacks supporting swarm (robot to robot) interaction.
The gazebo simulator runs in the same EKS cluster as the associated experiment containers and loads world files on initialisation. The world files are predefined for the validation mode and are not replaceable. However, for the experiment mode, they can be overwritten with user-defined files. A volume mount is specified for the worlds directory to achieve defining user-defined files. Experiment containers are initialised for each emulated robot and are passed the environment variable
ROBOTIDto distinguish which robot they correspond to. Robot models are contained in theurdfdirectory and are initialised for each emulated robot within the simulator instance by the experiment containers.When setting up the experiment configuration, the user can specify the friendly name (ROS2 partition prefix/namespace) for each robot instance in the portal GUI. The robot model nodes are instanced for each identifier name (see controller.launch.py).
controller_cmd = Node(
    package     = 'dots_example_controller',
    executable  = controller_option,
    namespace   = robot_name,
    output      = 'screen',
    parameters  = [ {'use_sim_time' : use_sim_time}]
)
The controller nodes are also instanced with experiment containers being passed the corresponding robot name via the ROBOTID environment variable. Users can use this for specifying the ROS2 bag folder name for storing log data such as odometry, as shown below.
ld.add_entity(ExecuteProcess(
    cmd=['ros2', 'bag', 'record',
        '--compression-mode', 'file',
        '--compression-format', 'zstd',
        '-o', '/storage/%s' % bag_name,
        '/%s/odom' % bag_name.replace("-0","")],
    output='screen'
))
All ROS2 DDS messages are then prefixed with the corresponding robot identifier within the robot local domain.
The ROS2bag logs are saved into files in the robot_data volume mount passed to the docker containers (/storage folder).
The P3D plugin publishes the ground truth from the simulator to the IoT Gateway, which is then passed to the appropriate radio simulator instances and stored in the Postgres database.
Map and video visualisations
Ground truth map visualisation shall permit the overlay of spatial sensor data such as heat maps, ground truth telemetry or other information. The testbed will provide the normal zoom and scroll capabilities with the ability to select and show different layers in a specified manner overlaid onto spatial maps. For instance, spatially interpolated sensor data heat maps or nodes and links with status colour coding. Users can use open layers or simple javascript frontend and Geoserver backend for this purpose.
The ground truth maps URL is:
http://<IOT_GW_ADDRESS>:8080/device/mapFor the heat map overlay the URL is:
http://<IOT_GW_ADDRESS>:8080/device/map?maptype=heatmap
For video streams, Users shall enable a simple selection function if multiple video sources are available. The experiment will display the video in an iFrame or video object in the portal window. The video server is hosted on the same arena server and is accessible via port 80.
Lora Testbed
Microservices
Lora service
Lora Service provides a wrapper interface over the Chirpstack Application server APIs to access and modify the Lora resources.
Lora resources information is not stored in Lora Service except the organization name and user name; all the information is maintained by Chirpstack storage.
It also allows the approval process for creating an organization and adding a user to an organization from Lora admin and organization admin, respectively.